论文阅读速记-Deep Learning With Data Enhancement for the Differentiation of Solitary and Multiple Cerebral Glioblastoma, Lymphoma, and Tumefactive Demyelinating Lesion
Deep Learning With Data Enhancement for the Differentiation of Solitary and Multiple Cerebral Glioblastoma, Lymphoma, and Tumefactive Demyelinating Lesion
论文作者: Zhang et al.
- GBM胶质瘤, PCNSL淋巴瘤, TDL瘤样脱髓鞘损伤
结论:Deep learning with data enhancement is useful for the accurate identification of GBM, PCNSL, and TDL, and its diagnostic performance is better than that of the neuroradiologists.
Introduction
- The open-ring enhancement in TDL may be an important sign that distinguishes it from other tumors
现有研究:These advanced MR modalities mainly focused only on the enhanced component of the lesion.
Another study reported that diffusion-weighted imaging (DWI) could be a useful diagnostic tool to differentiate among PCNSL, GBM, and inflammatory demyelination pseudotumor (10).
MRS had been a valuable approach to distinguish the mimicked pathologies (11).
现有研究:Radiomics-based analysis can explore the whole lesion including the enhanced and non-enhanced components.
- For example, the deep learning approach has been used for the differential diagnosis or grading in meningioma (12–14).
Materials and Methods
样本:97, 92, and 72 patients with GBM胶质瘤, PCNSL淋巴瘤, and TDL瘤样脱髓鞘损伤
数据集:The MRI acquisition protocols were composed of pre- and post- enhanced T1-weighted (CE-T1) images. (Supplementary File 2)
https://www.frontiersin.org/articles/10.3389/fonc.2021.665891/full#supplementary-material预处理(分割 Region of Interest): All MR images in the form of digital imaging and communications in medicine (DICOM) were input to the ITK- SNAP (version 3.4.0, www.itk-snap.org). The regions of interest (ROIs) of these three types of lesions were manually delineated on axial CE-T1 by a neuroradiologist using ITK-SNAP.
数据处理前请了两位10年经验神经外科医生进行了诊断,以便后续对比机器学习的性能
Algorithm Implementation: 分为三个步骤
The 261 subjects were randomly divided into a training set and a testing set.
All data were converted into a NIFTI format to adapt to a 3D network.
The diagnosis process is presented in Figure 1. It was divided into three stages and was not an end-to-end solution.

第一个步骤:3D U-Net
First, MRI was cropped to reduce the consumption of computing resources, and then the data were normalized to reduce the interference of medical image caused by uneven light.
The initial input network image size was reduced to 128 × 128 × 32 without affecting the segmentation performance.
entered to a convolution layer and four ResBlock downsampling modules -> the features obtained after the fourth downsampling were fused with the features obtained after the third downsampling module -> the fused features were entered into the upsampling ResBlock module to obtain the upsampling features. -> the image size was finally restored to 128 × 128 × 32
Finally, the number of channels were reduced to two after the image entered a convolution layer.
The segmentation mask was obtained by argmax function, and the segmentation mask was restored to 512 × 512 × 24 by bilinear interpolation.
第二个步骤:数据增强
- 把分割下来的病灶部分以一定倍数叠加到原图上
- In the second stage, the segmented lesion area was combined with the original MR image to change the pixels of the lesion area by a certain multiple, and the pixels of the non-lesion area were unchanged. The following combination equation was used:
Mn = M + M • n • k
Mn: enhanced data
M: original MRI
n: segmented mask
k: enhancement coefficient - In this experiment, five k values were selected, namely, −0.5, 0, 0.5, 1, and 2, to explore the best model.

第三个步骤:3D Resnet18
In the third stage, the enhanced data were preprocessed similar to the first stage.
Resnet 18 识别 GBM, PCNSL, and TDL.
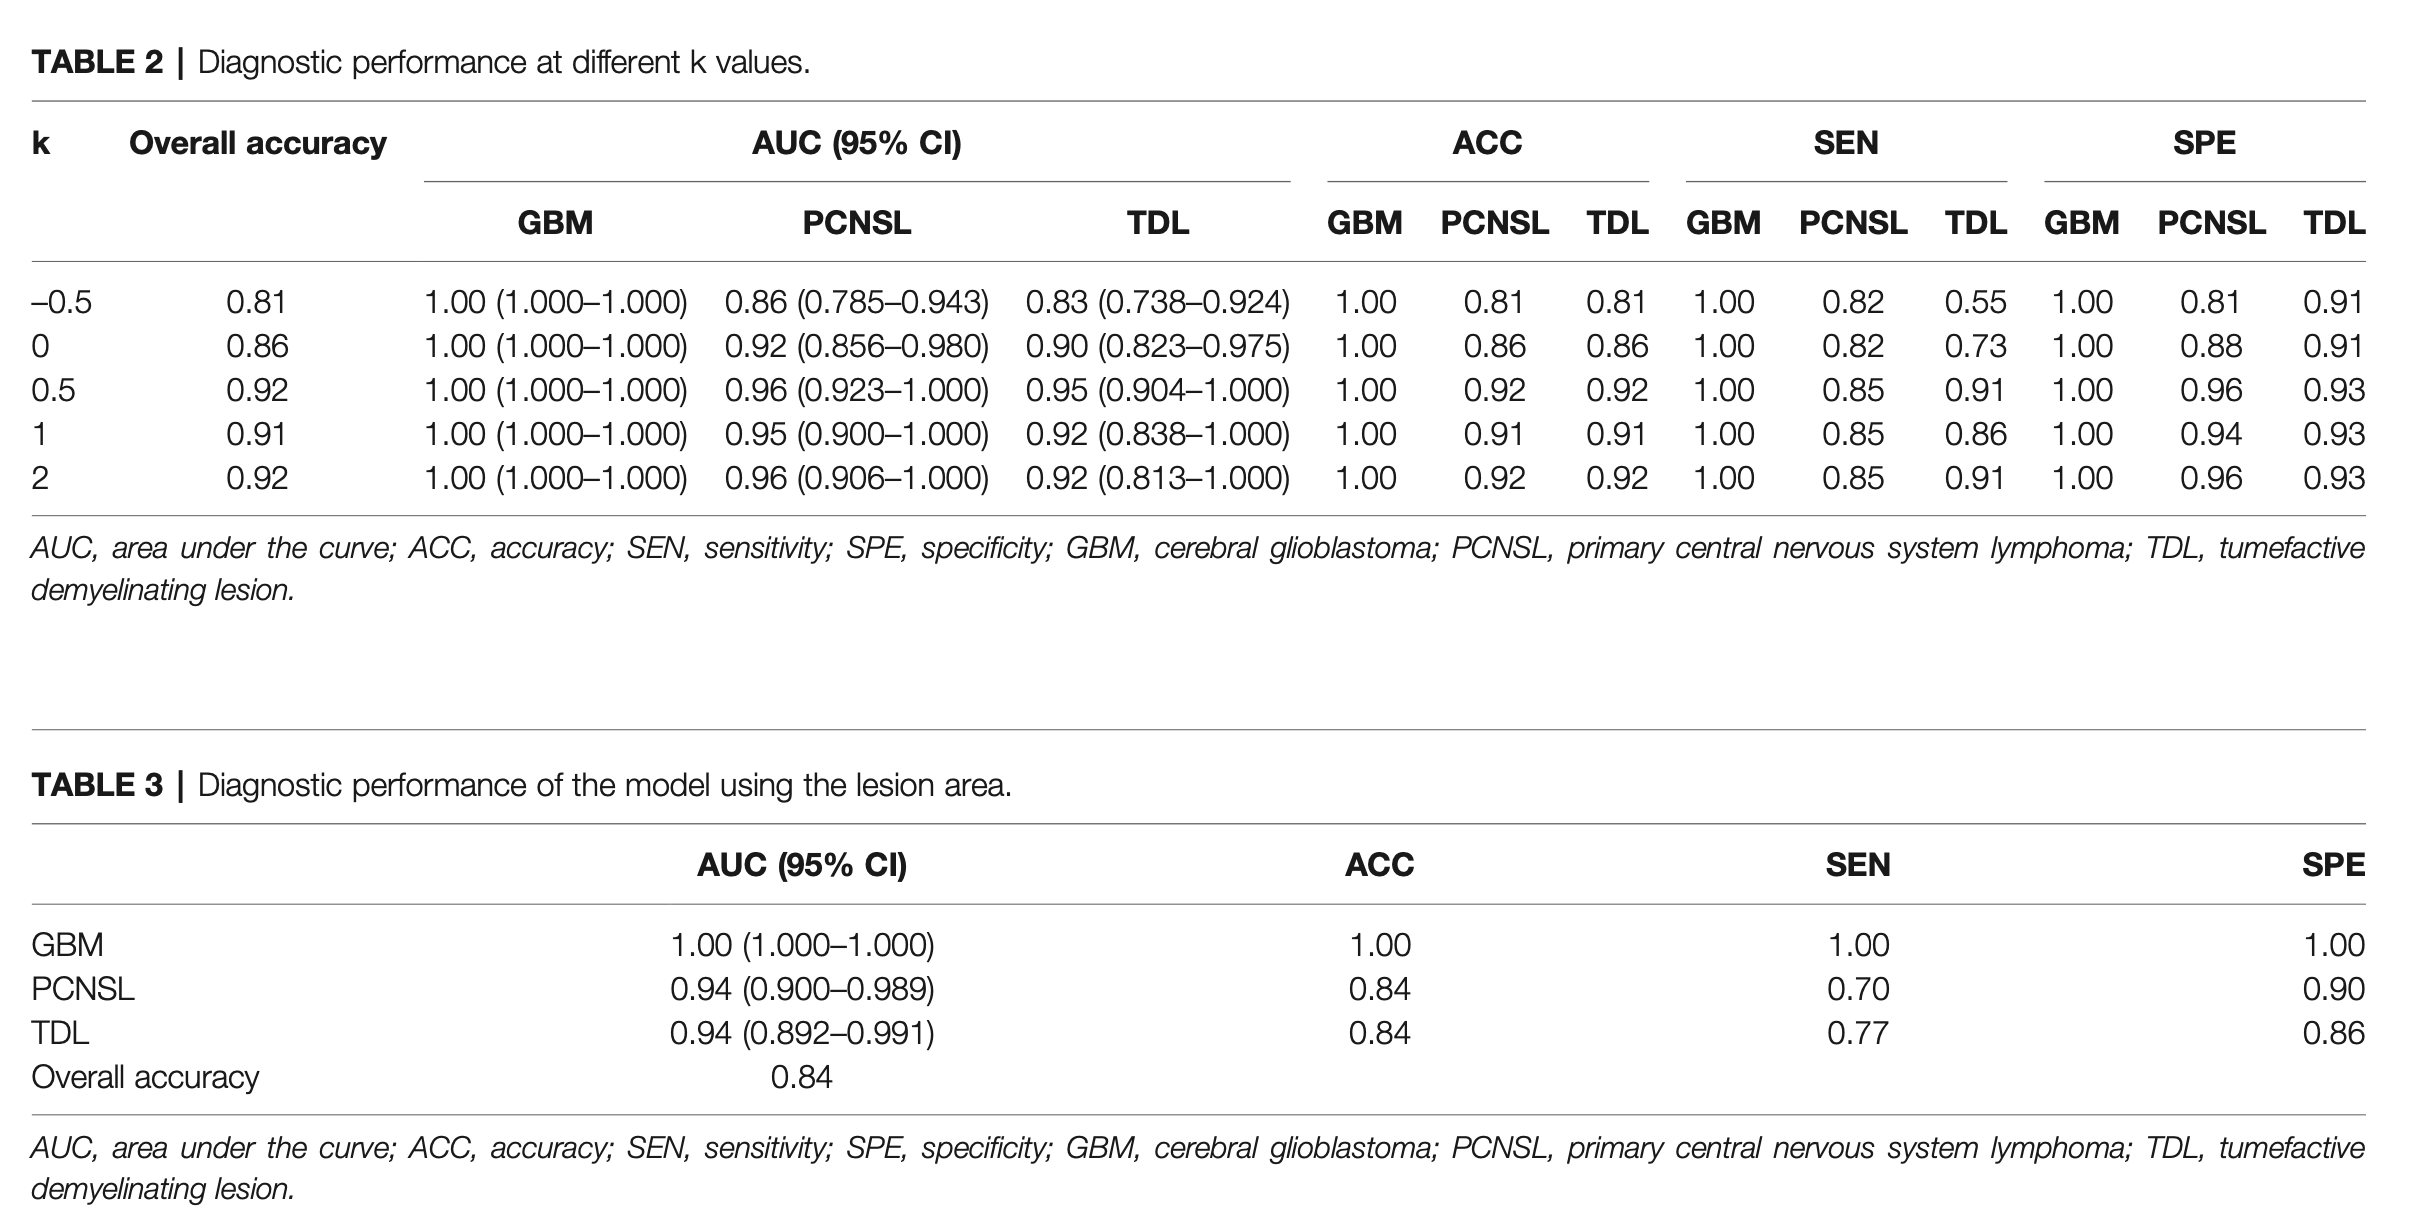
分别尝试了 k = −0.5, 0, 0.5, 1, 2与单独使用损伤区域进行识别

Results
结果
The diagnostic performance fluctuated with the ratio of lesion to non-lesion area changed. The diagnostic performance was best when the ratio was 1.5. The AUCs of GBM, PCNSL, and TDL were 1.00 (95% confidence interval [CI]: 1.000–1.000), 0.96 (95% CI: 0.923–1.000), and 0.954 (95% CI: 0.904–1.000), respectively.
The AUC (95% confidence interval [CI]), accuracy, sensitivity, specificity, and overall accuracy are presented in Tables 2 and 3. The ROC curves are shown in Figure 4. When k was 0.5, the diagnostic performance was the best, and the overall accuracy was 92.4%. The AUC (95% CI) of GBM, PCNSL, and TDL were 1.00 (1.000–1.000), 0.96 (0.923–1.000), and 0.95 (0.904–1.000), respectively. The selected radiomics features of GBM, PCNSL, and TDL at the optimal k value are shown in Figure 5. The overall diagnostic performances of the two neuroradiologists were 52.4%.


创新点:To our knowledge, our study is the first to simultaneously differentiate the three entities with solitary and multifocal types by radiomics analysis.
数据增强:准确率随病灶区域与非病灶区域占比提高先上升后下降,存在一个最优点,这时病灶区域和非病灶区域都包含了对识别有用的信息
Limitations
there may be some selection bias
not end-to-end: this makes it more challenging for non-professionals to use this diagnostic method.
Although we tried to use the end-to-end network for training, the existing data could not support training several times larger than the existing model to achieve better diagnostic performance.
Therefore, more data need to be collected to support end-to-end networks.this experiment only studied the differentiation of three radiologically similar lesions; neuroradiologists may consider additional diseases when making a diagnosis.
The existing supervised machine learning and deep learning methods can only diagnose the disease as one of the training set labels, and ignore other possible diseases.no external validation was performed.
only single-mode MRI data were used in this study.
Inclusion of multimodal data will provide more diagnostic information and is one of the important ways to improve diagnostic performance.
However, the single-model data reduce the difficulty of data collection, which makes our method more easily applicable to other diagnosis processes than other methods.